Welcome
Getting Started
-
Quick Start
Concepts
-
Product Concepts
-
The FHIR Standard
- FHIR Introduction
- FHIR Versions
- FHIR CRUD Operations
- FHIR Searching Basics
- FHIR Search: References and Includes
- FHIR Search: Custom Search Parameters
- FHIR Search: Combo Search Parameters
- FHIR Search: Enforcing Uniqueness
- FHIR Search: Uplifted Refchains
- FHIR Transactions and Batches
- FHIRPath Expressions
- FHIRPath Patch
-
Testing Tools
Guides
-
Installing
- Platform Requirements
- Preparing a Linux Host
- Installing Smile CDR, NGINX and PostgreSQL in a Docker Stack
- Deploying a Kubernetes Managed Cluster
- Docker Container Installation
- Configuring Smile CDR
- Unix Service Installation
- Tuning your Installation
- Designing a Cluster
- Message Brokers
- Message Broker Failure Management
- Message Broker: Kafka
- Message Broker: ActiveMQ
- Message Broker: Pulsar
- Pre-Seeding Configuration and Data
- Production Checklist
- Module Licensing
-
Upgrading
-
Planning
-
Implementation
-
Tutorials
- Introduction
- Integration Testing Tutorial
- Custom Operations Tutorial
- HL7 v2.x Ingestion Tutorial
- Federated OAuth2/OIDC Tutorial
- MDM Tutorial
- MDM UI
- CDA Import Tutorial
- CDA Export Tutorial
- CDA Export - Custom Narrative Generation Tutorial
- CDA Import JSON example
- CDA Export Template JSON example
- Consent Tutorial
Reference
-
FHIR Storage
- FHIR Storage Modules
- FHIR Endpoint Module
- FHIRWeb Console
- OpenAPI / Swagger Support
- FHIR Endpoint Customization
- Resource IDs
- Search Parameters
- Search Parameter Features
- Phonetic Search Parameters
- Search Parameter Tuning
- Search Parameter Reindexing
- Searching for Data
- Creating Data
- Reading Data
- Updating Data
- Deleting Data
- Binary Data
- Externalized Resource Body Storage
- Working with Duplicates
- Request Tracing and Provenance
- Resource Versions and Versioned References
- Tags, Profiles, and Security Labels
- Partitioning and Multitenancy
- Custom Resource Types
- Batch and Scheduled Jobs
- Tokenization
- Bulk Resource Modification
-
FHIR Storage (MongoDB)
-
Validation and Conformance
- Introduction
- Validation Support Repository
- Validation Support Repository Options
- Conformance Data
- Repository Validation
- Repository Validation: Java
- Repository Validation: Javascript
- Repository Validation: Validation Bean
- Endpoint Validation
- Packages and Implementation Guides
- Package Registry Endpoint Module
- Remote Terminology Services
- Suppressing Messages
- Validation Performance
- Automatic Provenance Injection
-
Semantic Standardization
-
Interceptors
- Interceptors
- Pointcuts
- Starter Project
- Examples: FHIR Endpoints
- Examples: HL7v2 Endpoints
- Examples: FHIR Storage
- Examples: FHIR Gateway
- Examples: FHIR Client
- Examples: MDM
- Examples: Subscription
- Examples: Channel Import
- Examples: Cluster Manager
- Examples: App Sphere
- Examples: System To System Data Exchange
- 2024.02.01 Migration Guide
-
Channel Import
-
Security
- Authentication Protocols
- Authorization and Consent
- Inbound Security Module
- Local Inbound Security Module
- LDAP Inbound Security Module
- Scripted Inbound Security Module
- SAML Inbound Security Module
- Trusted Client Mode
- Roles and Permissions
- Callback Scripts
- Anonymous Access
- Consent Service
- Consent Service: JavaScript API
- Consent Service: Java API
- Security Recipes
- Two Factor Authentication
- Password Hashing Algorithms
- JWT Signature Algorithms
- Troubleshooting Security
-
Consent Module
-
SMART on FHIR
- SMART on FHIR: Introduction
- SMART: Scopes
- SMART: Auth Flows
- SMART: Endpoints
- SMART: Smile CDR Support
- SMART Outbound Security: Module
- SMART Outbound Security: Skinning
- SMART Outbound Security: Context Selection
- SMART Outbound Security: SAML Bridging
- SMART: Federated OAuth2/OIDC Login
- SMART: Application Approval/Consent
- SMART Inbound Security Module
- SMART Client Definitions
- SMART Server Definitions
- SMART OIDC Keystore Definitions
- SMART: Session Management
- SMART: Assigning Permissions
- SMART: Access Tokens
- SMART: User Profile Information
- FHIR Client Authentication
- SMART: Machine to Machine Authentication
-
FHIR Hybrid Providers
-
CDS Hooks
-
IG Support
-
HL7 v2.x Support
- Introduction
- Inbound Messaging
- FHIR-Based Terminology Translation
- Outbound Messaging
- Outbound: Default Resource Conversion
- Outbound: Custom Resource Conversion
- Outbound: Verbatim Messaging
- Outbound: Transport
- Transactions
- Structure Definitions
- Segment Definitions
- Table Definitions
- Naming System Mapping
- Processing Results Feeds
- Protocol
-
CDA Exchange+ Module
-
System to System Data Exchange
-
Bulk Operations
-
Additional Features
-
Product Administration
-
JSON Admin Endpoints
- JSON Admin API
- JSON Admin Home Endpoint
- MDM Endpoint
- Audit Log Endpoint
- Batch Job Endpoint
- Bulk Import Endpoint
- CDA Exchange Endpoint
- Config Diagnostics Endpoint
- Metrics Endpoint
- Module Config Endpoint
- OpenID Connect Clients Endpoint
- OpenID Connect Keystores Endpoint
- OpenID Connect Servers Endpoint
- OpenID Connect Sessions Endpoint
- Privacy Notice Endpoint
- Runtime Status Endpoint
- System Config Endpoint
- Transaction Log Endpoint
- Troubleshooting Log Endpoint
- User Management Endpoint
- Version Endpoint
-
HFQL: Direct SQL Access
-
Product Configuration
-
Java Execution Environment
-
JavaScript Execution Environment
- Introduction
- Specifying JavaScript in Configuration File
- Remote Debugging
- ECMA Modules (import)
- Converter API
- Environment API
- Exceptions API
- OAuth2 Exceptions API
- FHIR REST API
- FHIR Model API
- HL7 v2.x Mapping API
- HTTP API
- LDAP API
- Log API
- Composition Resource API
- Composition Section API
- TransactionBuilder API
- Util API
- UUID API
- XML API
- Callback Models
-
Localization
-
Smile CDR CLI (smileutil)
- Introduction
- Bulk Import
- Create FHIR Package
- Execute Script Function
- Export ConceptMap to CSV
- HL7 v2.x Analyze Flat File
- HL7 v2.x Transmit Flat File
- Import CSV to ConceptMap
- Map and Upload CSV Bulk Import File
- Migrate Database
- Clear Database Migration Lock
- Module Config Properties Export
- Reindex Terminology
- Synchronize FHIR Servers
- Upgrade H2 Database File
- Upload Bundle Files
- Upload CSV Bulk Import File
- Upload Sample Dataset
- Upload Terminology
- Generate Realtime Export Schema
- Validate FHIR Resources
-
Apache Camel Integration
- Camel Module Overview
- Smile Camel Processors
- Processors: FHIR Storage module
- Processors: ETL Import module
- Processors: Camel module
- Processors: Cluster Manager module
- Processors: HL7v2 Inbound module
- Processors: CDA Exchange+ module
- Processors: Semantic Standardization module
- Processors: Transaction Logging
- Smile Camel Converters
- Smile Camel Recipes
-
Prior Auth CRD (Coverage Requirement Discovery)
-
Prior Auth DTR (Documentation Templates and Rules)
-
Prior Auth Support
-
Smile Portal
-
Davinci Data Exchange
-
Modules
- JSON Admin API
- Web Admin Console
- CDA Exchange+
- CDA Exchange(Deprecated)
- Channel Import
- Cluster Manager
- CQL
- Audit Log Persistence
- Audit Log OpenTelemetry
- Transaction Log Persistence
- Transaction Log OpenTelemetry
- Digital Quality Measures (DQM)
- Documentation Templates and Rules (DTR)
- Enterprise Master Patient Index
- CDS Hooks Endpoint
- FHIR Gateway Endpoint
- FHIR REST Endpoint (All Versions)
- FHIR REST Endpoint (DSTU2 - Deprecated)
- FHIR REST Endpoint (DSTU3 - Deprecated)
- FHIR REST Endpoint (R4 - Deprecated)
- FHIRWeb Console
- HL7 v2.x Listening Endpoint
- HL7 v2.x Listening Endpoint (Deprecated)
- HL7 v2.x Sending Endpoint
- Hybrid Providers Endpoint
- Package Registry Endpoint
- Subscription Websocket Endpoint
- ETL Importer
- MDM
- MDM UI
- Prior Auth CRD
- Prior Auth Support
- Narrative Generator
- FHIR Storage (DSTU2 RDBMS)
- FHIR Storage (R3 RDBMS)
- FHIR Storage (R4 RDBMS)
- FHIR Storage (R5 RDBMS)
- FHIR Storage (Mongo)
- Realtime Export
- LDAP Inbound Security
- Local Inbound Security
- SAML Inbound Security
- Scripted Inbound Security
- SMART Inbound Security
- SMART Outbound Security
- Subscription Matcher (All FHIR Versions)
- Subscription Matcher (DSTU2 - Deprecated)
- Subscription Matcher (DSTU3 - Deprecated)
- Subscription Matcher (R4 - Deprecated)
- appSphere
- Payer to Payer (Deprecated)
- System to System Data Exchange
- License
- Camel
- Consent Module
- Smile Portal
- Davinci Data Exchange
-
Appendix
Generated Reference
-
Configuration Categories
- Web Admin Console Settings
- appSphere
- Payer Config
- Initial appSphere Seeding
- Authentication Callback Scripts
- Auth: General for APIs
- User Authentication
- Auth: HTTP Basic
- Auth: OpenID Connect
- Browser Syntax Highlighting
- Camel
- Capability Statement (metadata)
- Care Gaps
- CDA Export
- CDA Import
- CDA Interceptors
- CDA JavaScript Execution Scripts
- CDA Terminology
- CDS Hooks Definitions
- CDS Hooks On FHIR
- Channel Import
- Channel Retry
- Cluster Manager Interceptors
- Kafka
- Cluster Manager Maintenance
- Message Broker
- Pulsar
- Cluster Level Security
- Consent
- CQL
- Credentials
- Cross-Origin Resource Sharing (CORS)
- Invoke Export
- Member Match
- Database
- Da Vinci Health Record Exchange
- EasyShare SMART Health Links
- Email Configuration
- MDM UI
- ETL Import: CSV Properties
- ETL Import: Source
- Measure Evaluation
- External Object Storage
- FHIR Binary Storage
- FHIR Bulk Modification Operations
- FHIR Bulk Import/Export Operations
- Capability Statement
- FHIR Configuration
- Consent Service
- FHIR Endpoint Conversion
- FHIR Endpoint HFQL Support
- FHIR Endpoint Partitioning
- Resource Providers
- FHIR Endpoint Security
- Endpoint Terminology
- FHIR Gateway Cache
- FHIR Gateway Configuration
- FHIR Interceptors
- LiveBundle Service
- FHIR MDM Server
- FHIR Performance
- FHIR Performance Tracing
- FHIR Realtime Export
- Repository Validation
- FHIR Resource Body Storage
- FHIR Resource Types
- FHIR REST Endpoint
- FHIR Search
- Custom Resource Types
- IG Support
- MegaScale
- FHIR Storage Module Conditional Updates
- FHIR Storage Module Scheduled Tasks
- FHIR Validation Services
- FHIR Validation Services Remote Terminology Client TLS / SSL (Encryption)
- FHIR Storage Package Registry
- FHIR Storage Partitioning
- Versioned References
- FHIR Subscription Delivery
- FHIR Subscription Persistence
- FHIR Tokenization
- Full-Text Indexing
- HL7 v2.x Mapper - Contained Resource
- HL7 v2.x Mapper - DG1
- HL7 v2.x Mapper - Forced Namespace Mode
- HL7 v2.x Mapper - General
- HL7 v2.x Mapper - Medications
- HL7 v2.x Mapper - OBR
- HL7 v2.x to FHIR Mapper - OBSERVATION Group
- HL7 v2.x Mapper - ORC
- HL7 v2.x to FHIR Mapper - ORDER_OBSERVATION Group
- HL7 v2.x Mapper - PID
- HL7 v2.x Mapper - PV1
- HL7 v2.x Mapper - TXA
- Listener Interceptors
- HL7 v2.x Listener Script
- HL7 v2.x Listening Endpoint
- HL7 v2.x MLLP Listener
- HL7 v2.x MLLP Sender
- FHIR to HL7 v2.x Mapper Script
- HL7 v2.x Outbound Mapping
- HTTP Access Log
- HTTP Listener
- HTTP Request Pool
- HTTP Security
- Hybrid Providers Definitions
- IG Support
- Initial Custom Roles Seeding
- Initial User Seeding
- JavaScript Execution Environment
- JSON Web KeySet (JWKS)
- LDAP Authentication
- Smile CDR License
- MDM
- Migration
- Narrative Generator
- OpenID Connect Token Validation
- OpenID Connect (OIDC)
- Prior Authorization Coverage Requirement Discovery
- Prior Authorization Documentation Templates and Requirements
- Prior Authorization Support
- Privacy Security Notice
- Provenance Injection
- Quality Payment Program (QPP)
- Realtime Export
- Endpoint Validation: Request Validating
- Search Parameter Seeding
- SAML Provider
- Security Inbound Script
- Inbound SMART on FHIR Authentication
- Inbound SMART on FHIR Endpoints
- OAuth2/OIDC Federation
- SMART Callback Script
- Cross-Organizational Data Access Profile
- SMART Login Skin
- SMART Login Terms of Service
- SMART Authorization
- SMART Definitions Seeding
- Semantic Standardization Configuration
- Sessions
- Smile Portal
- Two Factor Authentication
- TLS / SSL (Encryption)
- Transaction Log
- Trusted Client
- User Self Registration
-
Module Dependencies
-
Product Reference
-
Tags
- Pages tagged with "activemq"
- Pages tagged with "admin-json"
- Pages tagged with "admin-ui"
- Pages tagged with "advanced"
- Pages tagged with "api"
- Pages tagged with "app-gallery"
- Pages tagged with "architecture"
- Pages tagged with "audit"
- Pages tagged with "authentication"
- Pages tagged with "authorization"
- Pages tagged with "automation"
- Pages tagged with "aws"
- Pages tagged with "azure"
- Pages tagged with "batch-operations"
- Pages tagged with "batch-processing"
- Pages tagged with "beginner"
- Pages tagged with "best-practices"
- Pages tagged with "bulk-operations"
- Pages tagged with "caching"
- Pages tagged with "camel"
- Pages tagged with "care-gaps"
- Pages tagged with "cda"
- Pages tagged with "cda-exchange-plus"
- Pages tagged with "cds"
- Pages tagged with "cds-hooks"
- Pages tagged with "certification"
- Pages tagged with "changelog"
- Pages tagged with "channel-import"
- Pages tagged with "clinical-reasoning"
- Pages tagged with "cloud"
- Pages tagged with "cluster"
- Pages tagged with "codesystem"
- Pages tagged with "compliance"
- Pages tagged with "composition"
- Pages tagged with "concept"
- Pages tagged with "conceptmap"
- Pages tagged with "configuration"
- Pages tagged with "conformance"
- Pages tagged with "consent"
- Pages tagged with "conversion"
- Pages tagged with "cql"
- Pages tagged with "csv"
- Pages tagged with "customization"
- Pages tagged with "da-vinci"
- Pages tagged with "database"
- Pages tagged with "davinci"
- Pages tagged with "debugging"
- Pages tagged with "dependencies"
- Pages tagged with "deployment"
- Pages tagged with "deprecated"
- Pages tagged with "developer"
- Pages tagged with "diagnostics"
- Pages tagged with "docker"
- Pages tagged with "document-generation"
- Pages tagged with "documentation"
- Pages tagged with "dqm"
- Pages tagged with "easyshare"
- Pages tagged with "elasticsearch"
- Pages tagged with "error-handling"
- Pages tagged with "etl"
- Pages tagged with "etl-import"
- Pages tagged with "experimental"
- Pages tagged with "export"
- Pages tagged with "feature-maturity"
- Pages tagged with "features"
- Pages tagged with "fhir"
- Pages tagged with "fhir-client"
- Pages tagged with "fhir-endpoint"
- Pages tagged with "fhir-gateway"
- Pages tagged with "fhir-repository"
- Pages tagged with "fhir-storage"
- Pages tagged with "fhirpath"
- Pages tagged with "getting-started"
- Pages tagged with "grafana"
- Pages tagged with "guide"
- Pages tagged with "health-checks"
- Pages tagged with "hl7v2"
- Pages tagged with "how-to"
- Pages tagged with "howto"
- Pages tagged with "http"
- Pages tagged with "hybrid-providers"
- Pages tagged with "indexing"
- Pages tagged with "ingestion"
- Pages tagged with "integration"
- Pages tagged with "interceptors"
- Pages tagged with "intermediate"
- Pages tagged with "internationalization"
- Pages tagged with "interoperability"
- Pages tagged with "java"
- Pages tagged with "javascript"
- Pages tagged with "jdbc"
- Pages tagged with "junit"
- Pages tagged with "jvm"
- Pages tagged with "jwt"
- Pages tagged with "kafka"
- Pages tagged with "kubernetes"
- Pages tagged with "ldap"
- Pages tagged with "libraries"
- Pages tagged with "licensing"
- Pages tagged with "linux"
- Pages tagged with "logging"
- Pages tagged with "logs"
- Pages tagged with "loinc"
- Pages tagged with "mappings"
- Pages tagged with "mariadb"
- Pages tagged with "mdm"
- Pages tagged with "member-match"
- Pages tagged with "message-broker"
- Pages tagged with "messaging"
- Pages tagged with "metrics"
- Pages tagged with "migration"
- Pages tagged with "module-management"
- Pages tagged with "mongodb"
- Pages tagged with "monitoring"
- Pages tagged with "mssql"
- Pages tagged with "mysql"
- Pages tagged with "narrative"
- Pages tagged with "navigation"
- Pages tagged with "ndjson"
- Pages tagged with "nginx"
- Pages tagged with "oauth2"
- Pages tagged with "observability"
- Pages tagged with "openid"
- Pages tagged with "opentelemetry"
- Pages tagged with "operations"
- Pages tagged with "oracle"
- Pages tagged with "otel"
- Pages tagged with "overview"
- Pages tagged with "packages"
- Pages tagged with "partitioning"
- Pages tagged with "patient"
- Pages tagged with "patient-matching"
- Pages tagged with "payer-to-payer"
- Pages tagged with "performance"
- Pages tagged with "permissions"
- Pages tagged with "postgresql"
- Pages tagged with "premium"
- Pages tagged with "privacy"
- Pages tagged with "processors"
- Pages tagged with "product-administration"
- Pages tagged with "product-lifecycle"
- Pages tagged with "product-planning"
- Pages tagged with "production"
- Pages tagged with "prometheus"
- Pages tagged with "provenance"
- Pages tagged with "pulsar"
- Pages tagged with "quality-measures"
- Pages tagged with "redis"
- Pages tagged with "reference"
- Pages tagged with "releases"
- Pages tagged with "remote-services"
- Pages tagged with "repository"
- Pages tagged with "rest-api"
- Pages tagged with "roadmap"
- Pages tagged with "saml"
- Pages tagged with "scripting"
- Pages tagged with "sdc"
- Pages tagged with "search"
- Pages tagged with "security"
- Pages tagged with "semantic-standardization"
- Pages tagged with "session-management"
- Pages tagged with "smart"
- Pages tagged with "snomed"
- Pages tagged with "spring-batch"
- Pages tagged with "sql"
- Pages tagged with "storage"
- Pages tagged with "structuredefinition"
- Pages tagged with "subscription"
- Pages tagged with "swagger"
- Pages tagged with "system-to-system-data-exchange"
- Pages tagged with "systemd"
- Pages tagged with "templates"
- Pages tagged with "terminology"
- Pages tagged with "testcontainers"
- Pages tagged with "testing"
- Pages tagged with "tls"
- Pages tagged with "transaction-logging"
- Pages tagged with "transactions"
- Pages tagged with "transformation"
- Pages tagged with "translation"
- Pages tagged with "troubleshooting"
- Pages tagged with "tutorial"
- Pages tagged with "upgrading"
- Pages tagged with "user-management"
- Pages tagged with "validation"
- Pages tagged with "valueset"
- Pages tagged with "version-info"
- Pages tagged with "versioning"
- Pages tagged with "web-ui"
- Pages tagged with "websocket"
- Pages tagged with "xml"
Externalized Metrics
8.1.1Externalized Metrics
Prior to the 2023.08 release, metrics appeared in Smile CDR. Metrics have now been externalized using Prometheus (to pull metrics from Smile CDR) and Grafana (to visualize the metrics). As of 2024.11, the builtin metrics within Smile CDR have been removed. Either externalized metrics or OpenTelemetry Integration is now required to view such information. In order to externalize metrics in Smile CDR, the following 4 steps must be completed in order.
8.1.2Step 1 - Install Prometheus
First, install Prometheus by referring to: https://prometheus.io/docs/introduction/first_steps/
Prometheus is configured using a YAML file. The Prometheus download comes with a sample configuration in a file called prometheus.yml. Modify this file to allow Prometheseus to scrape the metrics from SmileCDR.
Setup Prometheus with a configuration file:
- In the global config:
- Ensure external_labels > monitor is set to
smilecdr-monitoring
- Ensure external_labels > monitor is set to
- In the scrape_configs:
- Add a job with job_name:
smilecdrto the scrape_configs - Ensure metrics path for the
smilecdrjob is:/metrics/local/metrics - If using basic auth, ensure that username and password are set correctly
- Ensure targets URL points to your SmileCDR admin_json module URL and port number (default is port 9000)
- Ensure params.format is
['PROMETHEUS_V2']
- Add a job with job_name:
Additional options for the configuration file are available here: https://prometheus.io/docs/prometheus/latest/configuration/configuration/
A sample prometheus.yml configuration file is attached below that uses basic auth to authenticate the smile server. If testing locally using Docker, ensure the target for the smilecdr job is host.docker.internal:9000 instead.
global:
  scrape_interval: 15s # Set the scrape interval to every 15 seconds. Default is every 1 minute.
  evaluation_interval: 15s  # Evaluate rules every 15 seconds. The default is every 1 minute.
  external_labels:
    monitor: 'smilecdr-monitoring'

rule_files:
  # - "first.rules"
  # - "second.rules"

scrape_configs:
  - job_name: prometheus
    static_configs:
      - targets: ['localhost:9090']

  - job_name: smilecdr
    metrics_path: '/metrics/local/metrics'
    static_configs:
      - targets: ['localhost:9000']
    basic_auth:
      username: admin
      password: password
    params:
      format: ['PROMETHEUS_V2']
Deploy Prometheus to Kubernetes:
A sample YAML file for deployment to Kubernetes. Ensure that the 'hostname:port' value provided in the targets array points to your smilecdr instance.
---
apiVersion: v1
kind: ConfigMap
metadata:
  name: prometheus-config
data:
  prometheus.yml: |
    global:
      scrape_interval: 15s
      evaluation_interval: 15s
      external_labels:
        monitor: 'smilecdr-monitoring'
    scrape_configs:
      - job_name: 'prometheus'
        static_configs:
          - targets: ['localhost:9090']

      - job_name: smilecdr
        metrics_path: '/json-admin/metrics/local/metrics'
        scheme: https
        static_configs:
          - targets: ['smilecdr.example.com']
        basic_auth:
          username: admin
          password: password
        params:
          format: ['PROMETHEUS_V2']

---
apiVersion: apps/v1
kind: Deployment
metadata:
  name: prometheus-deployment
spec:
  replicas: 1
  selector:
    matchLabels:
      app: prometheus
  template:
    metadata:
      labels:
        app: prometheus
    spec:
      containers:
      - name: prometheus
        image: "quay.io/prometheus/prometheus:v2.49.1"
        args:
          - "--config.file=/etc/prometheus/prometheus.yml"
          - "--storage.tsdb.path=/prometheus/"
        ports:
        - containerPort: 9090
        volumeMounts:
        - name: config-volume
          mountPath: /etc/prometheus
        - name: prometheus-storage
          mountPath: /prometheus
      volumes:
      - name: config-volume
        configMap:
          name: prometheus-config
      - name: prometheus-storage
        persistentVolumeClaim:
          claimName: prometheus-server-pvc

---
apiVersion: v1
kind: PersistentVolumeClaim
metadata:
  labels:
    app.kubernetes.io/component: server
    app.kubernetes.io/name: prometheus
    app.kubernetes.io/part-of: prometheus
  name: prometheus-server-pvc
spec:
  accessModes:
    - ReadWriteOnce
  storageClassName: "gp2"
  resources:
    requests:
      storage: "8Gi"
Note that: Above persistentVolumeCliam is used for Amazon Web Services' Elastic Block Store (EBS). The corresponding storageClassName should be defined based on your cloud environment.
8.1.3Step 2 - Install Grafana
Install Grafana using the instructions found here: https://grafana.com/docs/grafana/latest/setup-grafana/installation/.
8.1.4Step 3 - Creating a Prometheus data source on Grafana
These instructions were adopted from: https://prometheus.io/docs/visualization/grafana/
To create a Prometheus data source in Grafana:
- Click on the "cogwheel" in the sidebar to open the Configuration menu.
- Click on "Data Sources".
- Click on "Add data source".
- Select "Prometheus" as the type.
- Set the appropriate Prometheus server URL (for example,
http://localhost:9090/). If running Prometheus in docker locally for testing purposes, use:http://host.docker.internal:9090. - Adjust other data source settings as desired (for example, choosing the right Access method).
- Click "Save & Test" to save the new data source.
8.1.5Step 4 - Configure Smile CDR
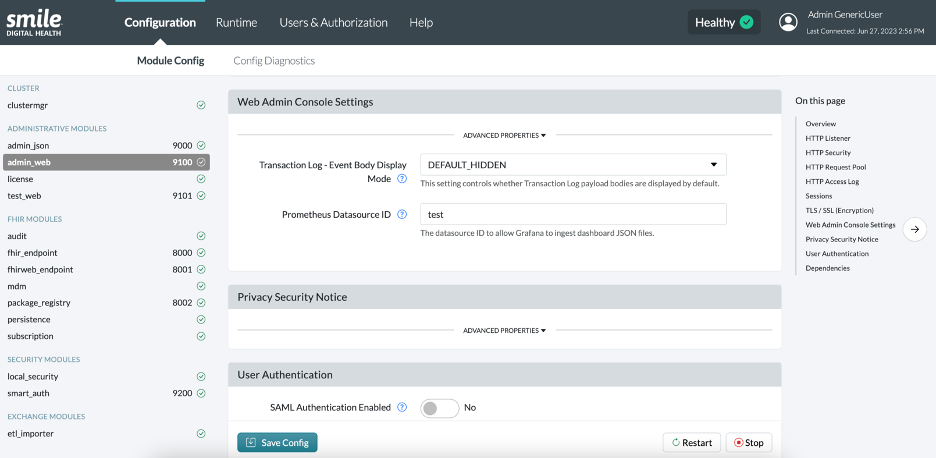
In Grafana, each datasource has a unique ID. For the Prometheus datasource that you just created, obtain the ID by editing the datasource, and copying everything after the final "/":
For the following URL: http://localhost:3000/datasources/edit/z0tPZ2-Vz
The datasource ID is: z0tPZ2-Vz
Copy this value, and in SmileCDR in the admin_web console, populate the Prometheus Datasource ID with that value. Save and restart the module.
Select the module you want a dashboard for and click "Download Grafana JSON". Unzip the .zip file, you will be uploading the JSON file contained within the zip file to Grafana to create the dashboard in Step 5. Do this for each module.
8.1.6Step 5 - Creating a Grafana Dashboard
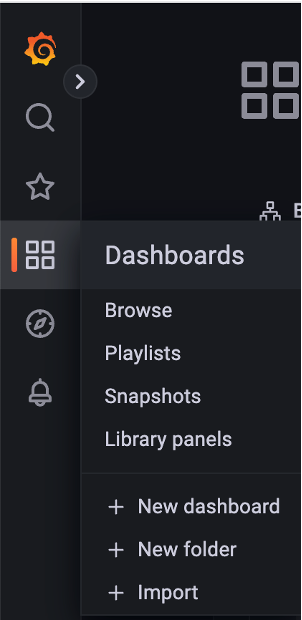
- In the left sidebar, go to the explore tab, and click on "Dashboards"
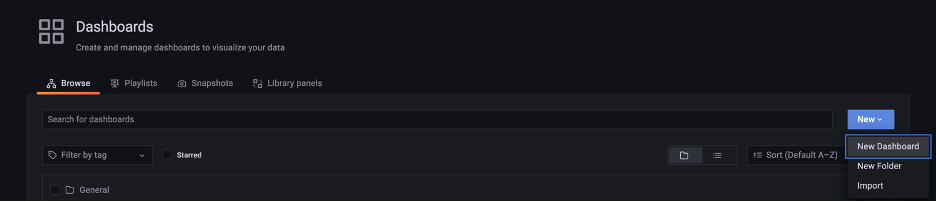
- When in dashboards, click "New" button, then "Import"
- Click the "Upload JSON file" button and upload the JSON file downloaded from Smile CDR.
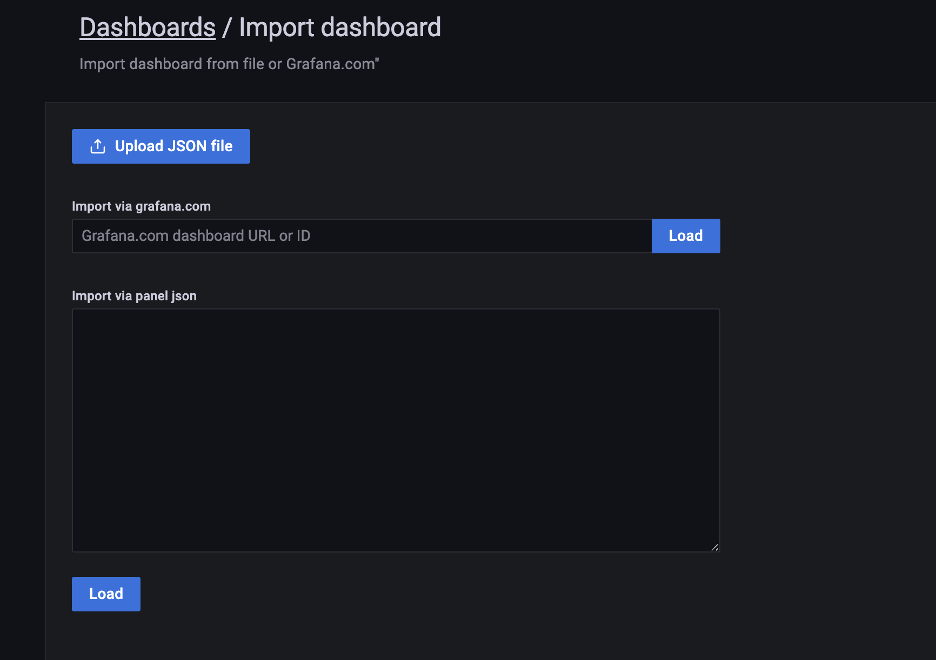
- Dashboard for the module should now be created and will appear in dashboards.