Welcome
Getting Started
-
Quick Start
Concepts
-
Product Concepts
-
The FHIR Standard
- FHIR Introduction
- FHIR Versions
- FHIR CRUD Operations
- FHIR Searching Basics
- FHIR Search: References and Includes
- FHIR Search: Custom Search Parameters
- FHIR Search: Combo Search Parameters
- FHIR Search: Enforcing Uniqueness
- FHIR Search: Uplifted Refchains
- FHIR Transactions and Batches
- FHIRPath Expressions
- FHIRPath Patch
-
Testing Tools
Guides
-
Installing
- Platform Requirements
- Preparing a Linux Host
- Installing Smile CDR, NGINX and PostgreSQL in a Docker Stack
- Deploying a Kubernetes Managed Cluster
- Docker Container Installation
- Configuring Smile CDR
- Unix Service Installation
- Tuning your Installation
- Designing a Cluster
- Message Brokers
- Message Broker Failure Management
- Message Broker: Kafka
- Message Broker: ActiveMQ
- Message Broker: Pulsar
- Pre-Seeding Configuration and Data
- Production Checklist
- Module Licensing
-
Upgrading
-
Planning
-
Implementation
-
Tutorials
- Introduction
- Integration Testing Tutorial
- Custom Operations Tutorial
- HL7 v2.x Ingestion Tutorial
- Federated OAuth2/OIDC Tutorial
- MDM Tutorial
- MDM UI Tutorial
- MDM First Golden Resource Tutorial
- MDM Advanced Rule Authoring Tutorial
- MDM Web UI Admin Setup Tutorial
- CDA Import Tutorial
- CDA Export Tutorial
- CDA Export - Custom Narrative Generation Tutorial
- CDA Import JSON example
- CDA Export Template JSON example
- Consent Tutorial
- CMS-0057-F IG Setup Tutorial
Reference
-
FHIR Storage
- FHIR Storage Modules
- FHIR Endpoint Module
- FHIRWeb Console
- OpenAPI / Swagger Support
- FHIR Endpoint Customization
- Resource IDs
- Search Parameters
- Search Parameter Features
- Phonetic Search Parameters
- Search Parameter Tuning
- Search Parameter Reindexing
- Searching for Data
- Creating Data
- Reading Data
- Updating Data
- Deleting Data
- Binary Data
- External Object Storage
- Externalized Resource Body Storage
- Request Tracing and Provenance
- Resource Versions and Versioned References
- Tags, Profiles, and Security Labels
- Partitioning and Multitenancy
- Patient ID Partitioning Modes
- Custom Resource Types
- Batch and Scheduled Jobs
- Tokenization
- Bulk Resource Modification
-
FHIR Storage (Relational)
- FHIR Storage (Relational) Module
- Resource Storage Mode
- Full-Text Indexing
- Performance and Caching
- Chained Searching and Sorting
- Scaling Smile CDR Databases
- MegaScale
- MegaScale Patient ID Partition Selection Modes
- Document Repository Mode
- Meta Source Migration
- Compressed Token Indexing
- Database Partition Mode
-
FHIR Storage (MongoDB)
-
Validation and Conformance
- Introduction
- Validation Support Repository
- Validation Support Repository Options
- Conformance Data
- Repository Validation
- Repository Validation: Java
- Repository Validation: Javascript
- Repository Validation: Custom Validation Beans
- Endpoint Validation
- Packages and Implementation Guides
- Package Registry Endpoint Module
- Remote Terminology Services
- Suppressing Messages
- Validation Performance
- Automatic Provenance Injection
-
Semantic Standardization
-
Interceptors
- Interceptors
- Pointcuts
- Starter Project
- Examples: FHIR Endpoints
- Examples: HL7v2 Endpoints
- Examples: FHIR Storage
- Examples: FHIR Gateway
- Examples: FHIR Client
- Examples: MDM
- Examples: Subscription
- Examples: Channel Import
- Examples: Cluster Manager
- Examples: App Sphere
- Examples: System To System Data Exchange
- 2024.02.01 Migration Guide
-
Channel Import
-
Security
- Authentication Protocols
- Authorization and Consent
- Inbound Security Module
- Local Inbound Security Module
- LDAP Inbound Security Module
- Scripted Inbound Security Module
- SAML Inbound Security Module
- Trusted Client Mode
- Roles and Permissions
- Callback Scripts
- Anonymous Access
- Consent Service
- Consent Service: JavaScript API
- Consent Service: Java API
- Security Recipes
- Two Factor Authentication
- Password Hashing Algorithms
- JWT Signature Algorithms
- Troubleshooting Security
-
Consent Module
-
SMART on FHIR
- SMART on FHIR: Introduction
- SMART: Scopes
- SMART: Auth Flows
- SMART: Endpoints
- SMART: Smile CDR Support
- SMART Outbound Security: Module
- SMART Outbound Security: Skinning
- SMART Outbound Security: Context Selection
- SMART Outbound Security: SAML Bridging
- SMART: Federated OAuth2/OIDC Login
- SMART: Application Approval/Consent
- SMART Inbound Security Module
- SMART Client Definitions
- SMART Server Definitions
- SMART OIDC Keystore Definitions
- SMART: Session Management
- SMART: Assigning Permissions
- SMART: Access Tokens
- SMART: User Profile Information
- FHIR Client Authentication
- SMART: Machine to Machine Authentication
-
FHIR Hybrid Providers
-
CDS Hooks
-
Master Data Management
- MDM
- Deduplication on Ingestion
- Integrating an External Entity Resolution Service
- Golden Record MDM
- Working with Duplicates
- MDM Rule Definition
- MDM Rule Schema Reference
- Supported Match Algorithms
- Custom MDM Matching Algorithms
- Using EIDs in MDM Rule Definition
- MDM Blocklist Definition
- MDM Survivorship Rules
- MDM Operations
- MDM API Operations Reference
- MDM Match Result Definitions
- MDM Virtualized Endpoint
- Upgrading from the EMPI module
-
IG Support
-
HL7 v2.x Support
- Introduction
- Inbound Messaging
- Inbound: Query Processing
- FHIR-Based Terminology Translation
- Outbound Messaging
- Outbound: Default Resource Conversion
- Outbound: Custom Resource Conversion
- Outbound: Verbatim Messaging
- Outbound: Transport
- Transactions
- Structure Definitions
- Segment Definitions
- Table Definitions
- Naming System Mapping
- Processing Results Feeds
- Protocol
-
CDA Exchange+ Module
-
Bulk Operations
-
Additional Features
-
Product Administration
-
JSON Admin Endpoints
- JSON Admin API
- JSON Admin Home Endpoint
- MDM Endpoint
- MDM Deprecation Migration
- Audit Log Endpoint
- Batch Job Endpoint
- Custom Scheduled Job Endpoint
- Bulk Import Endpoint
- CDA Exchange Endpoint
- Config Diagnostics Endpoint
- Metrics Endpoint
- Module Config Endpoint
- OpenID Connect Clients Endpoint
- OpenID Connect Keystores Endpoint
- OpenID Connect Servers Endpoint
- OpenID Connect Sessions Endpoint
- Privacy Notice Endpoint
- Runtime Status Endpoint
- System Config Endpoint
- Transaction Log Endpoint
- Troubleshooting Log Endpoint
- User Management Endpoint
- Version Endpoint
-
HFQL: Direct SQL Access
-
Product Configuration
-
Java Execution Environment
-
JavaScript Execution Environment
- Introduction
- Specifying JavaScript in Configuration File
- Remote Debugging
- ECMA Modules (import)
- Converter API
- Environment API
- Exceptions API
- OAuth2 Exceptions API
- FHIR REST API
- FHIR Model API
- HL7 v2.x Mapping API
- HTTP API
- LDAP API
- Log API
- Composition Resource API
- Composition Section API
- TransactionBuilder API
- Util API
- UUID API
- XML API
- Callback Models
-
Localization
-
Smile CDR CLI (smileutil)
- Introduction
- Bulk Import
- Create FHIR Package
- Execute Script Function
- Export ConceptMap to CSV
- HL7 v2.x Analyze Flat File
- HL7 v2.x Transmit Flat File
- Import CSV to ConceptMap
- Map and Upload CSV Bulk Import File
- Migrate Database
- Clear Database Migration Lock
- Module Config Properties Export
- Reindex Terminology
- Synchronize FHIR Servers
- Upgrade H2 Database File
- Upload Bundle Files
- Upload CSV Bulk Import File
- Upload Sample Dataset
- Upload Terminology
- Generate Realtime Export Schema
- Validate FHIR Resources
-
Apache Camel Integration
- Camel Module Overview
- Smile Camel Processors
- Processors: FHIR Storage module
- Processors: ETL Import module
- Processors: Camel module
- Processors: Cluster Manager module
- Processors: HL7v2 Inbound module
- Processors: CDA Exchange+ module
- Processors: Semantic Standardization module
- Processors: Transaction Logging
- Smile Camel Converters
- Smile Camel Recipes
- Smile Camel HTTP Endpoint
-
Smile Portal
-
Davinci Data Exchange
-
Modules
- JSON Admin API
- Web Admin Console
- CDA Exchange+
- Channel Import
- Cluster Manager
- Audit Log Persistence
- Audit Log OpenTelemetry
- Transaction Log Persistence
- Transaction Log OpenTelemetry
- Enterprise Master Patient Index
- CDS Hooks Endpoint
- FHIR Gateway Endpoint
- FHIR REST Endpoint (All Versions)
- FHIR REST Endpoint (DSTU2 - Deprecated)
- FHIR REST Endpoint (DSTU3 - Deprecated)
- FHIR REST Endpoint (R4 - Deprecated)
- FHIRWeb Console
- HL7 v2.x Listening Endpoint
- HL7 v2.x Listening Endpoint (Deprecated)
- HL7 v2.x Sending Endpoint
- Hybrid Providers Endpoint
- Package Registry Endpoint
- Subscription Websocket Endpoint
- ETL Importer
- MDM
- MDM UI
- Prior Auth CRD
- Prior Auth Support
- Narrative Generator
- FHIR Storage (DSTU2 RDBMS)
- FHIR Storage (R3 RDBMS)
- FHIR Storage (R4 RDBMS)
- FHIR Storage (R5 RDBMS)
- FHIR Storage (Mongo)
- Realtime Export
- Realtime Export (Delta Lake)
- Realtime Export (Bulk Batch Replication)
- LDAP Inbound Security
- Local Inbound Security
- SAML Inbound Security
- Scripted Inbound Security
- SMART Inbound Security
- SMART Outbound Security
- Subscription Matcher (All FHIR Versions)
- Subscription Matcher (DSTU2 - Deprecated)
- Subscription Matcher (DSTU3 - Deprecated)
- Subscription Matcher (R4 - Deprecated)
- appSphere
- Payer to Payer (Deprecated)
- System to System Data Exchange
- License
- Camel
- Smile Camel HTTP Endpoint
- Consent Module
- Smile Portal
- Davinci Data Exchange
-
Custom Scheduled Jobs
-
Appendix
Generated Reference
-
Configuration Categories
- Web Admin Console Settings
- appSphere
- Payer Config
- Initial appSphere Seeding
- Authentication Callback Scripts
- Auth: General for APIs
- User Authentication
- Auth: HTTP Basic
- Auth: OpenID Connect
- Browser Syntax Highlighting
- Bulk Batch Replication
- Camel HTTP Endpoint
- Camel
- Capability Statement (metadata)
- CDA Export
- CDA Import
- CDA Interceptors
- CDA JavaScript Execution Scripts
- CDA Terminology
- CDS Hooks Definitions
- CDS Hooks On FHIR
- Channel Import
- Channel Retry
- Cluster Manager Interceptors
- Kafka
- Cluster Manager Maintenance
- Message Broker
- Pulsar
- Cluster Level Security
- Consent
- Credentials
- Cross-Origin Resource Sharing (CORS)
- Invoke Export
- Member Match
- Database
- Da Vinci Health Record Exchange
- Delta Lake Export
- EasyShare SMART Health Links
- Email Configuration
- MDM UI
- ETL Import: CSV Properties
- ETL Import: Source
- External Object Storage
- FHIR Binary Storage
- FHIR Bulk Modification Operations
- FHIR Bulk Import/Export Operations
- Capability Statement
- FHIR Configuration
- Consent Service
- FHIR Endpoint Conversion
- FHIR Endpoint HFQL Support
- FHIR Endpoint Partitioning
- Resource Providers
- FHIR Endpoint Security
- Endpoint Terminology
- FHIR Gateway Cache
- FHIR Gateway Configuration
- FHIR Interceptors
- LiveBundle Service
- FHIR MDM Server
- FHIR Performance
- FHIR Performance Tracing
- FHIR Realtime Export
- Repository Validation
- FHIR Resource Body Storage
- FHIR Resource Types
- FHIR REST Endpoint
- FHIR Search
- Custom Resource Types
- IG Support
- MegaScale
- FHIR Storage Module Conditional Updates
- FHIR Storage Module Scheduled Tasks
- FHIR Validation Services
- FHIR Validation Services Remote Terminology Client TLS / SSL (Encryption)
- FHIR Storage Package Registry
- FHIR Storage Partitioning
- Versioned References
- FHIR Subscription Delivery
- FHIR Subscription Persistence
- FHIR Tokenization
- Full-Text Indexing
- HL7 v2.x Resource Deduplication
- HL7 v2.x Mapper - Contained Resource
- HL7 v2.x Mapper - DG1
- HL7 v2.x Mapper - Forced Namespace Mode
- HL7 v2.x Mapper - General
- HL7 v2.x Mapper - Medications
- HL7 v2.x Mapper - OBR
- HL7 v2.x to FHIR Mapper - OBSERVATION Group
- HL7 v2.x Mapper - ORC
- HL7 v2.x to FHIR Mapper - ORDER_OBSERVATION Group
- HL7 v2.x Mapper - PID
- HL7 v2.x Mapper - PV1
- HL7 v2.x Mapper - TXA
- Listener Interceptors
- HL7 v2.x Listener Script
- HL7 v2.x Listening Endpoint
- HL7 v2.x MLLP Listener
- HL7 v2.x MLLP Sender
- FHIR to HL7 v2.x Mapper Script
- HL7 v2.x Outbound Mapping
- HTTP Access Log
- HTTP Listener
- HTTP Request Pool
- HTTP Security
- Hybrid Providers Definitions
- IG Support
- Initial Custom Roles Seeding
- Initial User Seeding
- JavaScript Execution Environment
- JSON Web KeySet (JWKS)
- LDAP Authentication
- Smile CDR License
- MDM
- Migration
- Narrative Generator
- OpenID Connect Token Validation
- OpenID Connect (OIDC)
- Prior Authorization Coverage Requirement Discovery
- Prior Authorization Support
- Privacy Security Notice
- Provenance Injection
- Realtime Export
- Endpoint Validation: Request Validating
- Search Parameter Seeding
- SAML Provider
- Security Inbound Script
- Inbound SMART on FHIR Authentication
- Inbound SMART on FHIR Endpoints
- OAuth2/OIDC Federation
- SMART Callback Script
- Cross-Organizational Data Access Profile
- SMART Login Skin
- SMART Login Terms of Service
- SMART Authorization
- SMART Definitions Seeding
- Semantic Standardization Configuration
- Sessions
- Smile Portal
- Terminology Suggestions
- Two Factor Authentication
- TLS / SSL (Encryption)
- Transaction Log
- Trusted Client
- User Self Registration
-
Module Dependencies
-
Product Reference
Payer To Payer
-
Reference
Prior Authorization Solution
-
How-to Guides
-
Tutorials
Provider Access API
-
Tags
- Pages tagged with "activemq"
- Pages tagged with "admin-json"
- Pages tagged with "admin-ui"
- Pages tagged with "administration"
- Pages tagged with "advanced"
- Pages tagged with "api"
- Pages tagged with "app-gallery"
- Pages tagged with "architecture"
- Pages tagged with "audit"
- Pages tagged with "authentication"
- Pages tagged with "authorization"
- Pages tagged with "automation"
- Pages tagged with "aws"
- Pages tagged with "azure"
- Pages tagged with "batch"
- Pages tagged with "batch-operations"
- Pages tagged with "batch-processing"
- Pages tagged with "beginner"
- Pages tagged with "best-practices"
- Pages tagged with "bulk-operations"
- Pages tagged with "caching"
- Pages tagged with "camel"
- Pages tagged with "cda"
- Pages tagged with "cda-exchange-plus"
- Pages tagged with "cds-hooks"
- Pages tagged with "certification"
- Pages tagged with "changelog"
- Pages tagged with "channel-import"
- Pages tagged with "clinical-reasoning"
- Pages tagged with "cloud"
- Pages tagged with "cluster"
- Pages tagged with "codesystem"
- Pages tagged with "compliance"
- Pages tagged with "composition"
- Pages tagged with "concept"
- Pages tagged with "conceptmap"
- Pages tagged with "configuration"
- Pages tagged with "conformance"
- Pages tagged with "consent"
- Pages tagged with "conversion"
- Pages tagged with "csv"
- Pages tagged with "customization"
- Pages tagged with "cve"
- Pages tagged with "da-vinci"
- Pages tagged with "data-stewardship"
- Pages tagged with "database"
- Pages tagged with "davinci"
- Pages tagged with "debugging"
- Pages tagged with "delta-lake"
- Pages tagged with "dependencies"
- Pages tagged with "deployment"
- Pages tagged with "deprecated"
- Pages tagged with "developer"
- Pages tagged with "diagnostics"
- Pages tagged with "docker"
- Pages tagged with "document-generation"
- Pages tagged with "documentation"
- Pages tagged with "easyshare"
- Pages tagged with "elasticsearch"
- Pages tagged with "empi"
- Pages tagged with "error-handling"
- Pages tagged with "etl"
- Pages tagged with "etl-import"
- Pages tagged with "experimental"
- Pages tagged with "export"
- Pages tagged with "feature-maturity"
- Pages tagged with "features"
- Pages tagged with "fhir"
- Pages tagged with "fhir-client"
- Pages tagged with "fhir-endpoint"
- Pages tagged with "fhir-gateway"
- Pages tagged with "fhir-repository"
- Pages tagged with "fhir-storage"
- Pages tagged with "fhirpath"
- Pages tagged with "getting-started"
- Pages tagged with "grafana"
- Pages tagged with "guide"
- Pages tagged with "health-checks"
- Pages tagged with "hl7v2"
- Pages tagged with "how-to"
- Pages tagged with "howto"
- Pages tagged with "http"
- Pages tagged with "hybrid-providers"
- Pages tagged with "indexing"
- Pages tagged with "ingestion"
- Pages tagged with "integration"
- Pages tagged with "interceptor"
- Pages tagged with "interceptors"
- Pages tagged with "intermediate"
- Pages tagged with "internationalization"
- Pages tagged with "interoperability"
- Pages tagged with "java"
- Pages tagged with "javascript"
- Pages tagged with "jdbc"
- Pages tagged with "junit"
- Pages tagged with "jvm"
- Pages tagged with "jwt"
- Pages tagged with "kafka"
- Pages tagged with "kubernetes"
- Pages tagged with "ldap"
- Pages tagged with "libraries"
- Pages tagged with "licensing"
- Pages tagged with "linux"
- Pages tagged with "logging"
- Pages tagged with "logs"
- Pages tagged with "loinc"
- Pages tagged with "mappings"
- Pages tagged with "mariadb"
- Pages tagged with "mdm"
- Pages tagged with "member-match"
- Pages tagged with "message-broker"
- Pages tagged with "messaging"
- Pages tagged with "metrics"
- Pages tagged with "migration"
- Pages tagged with "module-management"
- Pages tagged with "mongodb"
- Pages tagged with "monitoring"
- Pages tagged with "mssql"
- Pages tagged with "narrative"
- Pages tagged with "navigation"
- Pages tagged with "ndjson"
- Pages tagged with "nginx"
- Pages tagged with "oauth2"
- Pages tagged with "observability"
- Pages tagged with "openid"
- Pages tagged with "opentelemetry"
- Pages tagged with "operations"
- Pages tagged with "oracle"
- Pages tagged with "otel"
- Pages tagged with "overview"
- Pages tagged with "package-install"
- Pages tagged with "packages"
- Pages tagged with "partitioning"
- Pages tagged with "patient"
- Pages tagged with "patient-matching"
- Pages tagged with "payer-to-payer"
- Pages tagged with "performance"
- Pages tagged with "permissions"
- Pages tagged with "postgresql"
- Pages tagged with "premium"
- Pages tagged with "privacy"
- Pages tagged with "processors"
- Pages tagged with "product-administration"
- Pages tagged with "product-lifecycle"
- Pages tagged with "product-planning"
- Pages tagged with "production"
- Pages tagged with "prometheus"
- Pages tagged with "provenance"
- Pages tagged with "pulsar"
- Pages tagged with "redis"
- Pages tagged with "reference"
- Pages tagged with "releases"
- Pages tagged with "remote-services"
- Pages tagged with "repository"
- Pages tagged with "rest-api"
- Pages tagged with "roadmap"
- Pages tagged with "rte"
- Pages tagged with "rule-authoring"
- Pages tagged with "saml"
- Pages tagged with "scaling"
- Pages tagged with "scheduled-jobs"
- Pages tagged with "scripting"
- Pages tagged with "search"
- Pages tagged with "security"
- Pages tagged with "semantic-standardization"
- Pages tagged with "session-management"
- Pages tagged with "setup"
- Pages tagged with "smart"
- Pages tagged with "snomed"
- Pages tagged with "spring-batch"
- Pages tagged with "sql"
- Pages tagged with "storage"
- Pages tagged with "structuredefinition"
- Pages tagged with "subscription"
- Pages tagged with "swagger"
- Pages tagged with "system-to-system-data-exchange"
- Pages tagged with "systemd"
- Pages tagged with "templates"
- Pages tagged with "terminology"
- Pages tagged with "testcontainers"
- Pages tagged with "testing"
- Pages tagged with "tls"
- Pages tagged with "transaction-logging"
- Pages tagged with "transactions"
- Pages tagged with "transformation"
- Pages tagged with "translation"
- Pages tagged with "troubleshooting"
- Pages tagged with "tutorial"
- Pages tagged with "upgrading"
- Pages tagged with "user-management"
- Pages tagged with "validation"
- Pages tagged with "valueset"
- Pages tagged with "version-info"
- Pages tagged with "versioning"
- Pages tagged with "vulnerabilities"
- Pages tagged with "web-ui"
- Pages tagged with "websocket"
- Pages tagged with "xml"
JavaScript Execution Environment Remote Debugging
Smile 2022.05 introduced support for JavaScript remote debugging via a Chrome browser.
Remote JavaScript debugging is enabled for a module in the "JavaScript Execution Environment" section of the module configuration. After enabling debug on the module, when you restart the module, if the module has any javascript callbacks configured, you will see a message in the logs that looks something like this:
Smile CDR JavaScript debugging enabled. Please copy-paste the following URL into a Chrome browser to continue startup: devtools://devtools/bundled/inspector.html?v8only=true&experiments=true&ws=localhost:9930/018b9c18-5efa-4163-b40d-a4b0b56bb4b3
The JavaScript Execution Environment presents itself to debug clients as a Node.js target, so this URL uses Chrome's inspector.html debugger front end.
Alternative Front End
Earlier Smile CDR releases logged Chrome's js_app.html front end instead.
Both front ends debug the same target, but if js_app.html opens a blank page with no source code,
keep the ws= portion of the logged URL exactly as it appears and substitute the older front end:
devtools://devtools/bundled/js_app.html?ws=localhost:9930/018b9c18-5efa-4163-b40d-a4b0b56bb4b3
The module will pause until you click the "Resume script execution" button, the blue arrow on the top-left of this image:
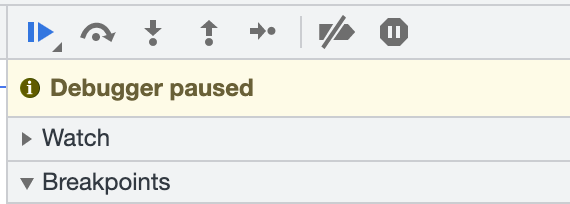
From here, you can set breakpoints, examine variables, step into functions, and any other typical debugging activity.
Configuration
Debug Host Address and Port control the address and port that the JavaScript Execution Environment binds its debug listener to, and Secure controls whether that listener uses TLS.
The default host address is localhost, which binds the loopback interface only, so the debugger can be reached only from the machine running Smile CDR.
Setting a host address that is reachable from the network — including the wildcard address 0.0.0.0, which binds every interface — makes the debugger reachable from every host that can route to that port. See Debugging a Containerized Deployment below for the one case where a wildcard bind is expected.
If Suspend is set to "No", then the log message with the URL will still be written to the log, but the module will not pause and wait for the debug client to connect. The debug client can connect any time after the log message appears.
If no Path is set, then the server will create a new random UUID every time the server restarts. You can override this and set the path what you want it to be. E.g. if you set the path to mysecretpath then the URL you need to connect to will look like:
Smile CDR JavaScript debugging enabled. Please copy-paste the following URL into a Chrome browser to continue startup: devtools://devtools/bundled/inspector.html?v8only=true&experiments=true&ws=localhost:9930/mysecretpath
Setting the path can be useful if you are frequently restarting your module so your chrome debugger can reconnect to the same url after every restart.
However, keep in mind that anyone with access to that port will be able to connect to this debug URL and potentially gain access to the system via the JavaScript execution environment; so we recommend if you set the Path that you choose a name that is difficult to guess.
Debugging a Containerized Deployment
A listener bound to localhost inside a container cannot be reached from outside that container. Traffic published with docker run -p arrives on the container's network interface rather than its loopback interface,
so a debug client running on the host is refused.
To debug JavaScript in a containerized Smile CDR, set Debug Host Address to the wildcard address 0.0.0.0 so that the listener also accepts connections arriving on the container's network interface.
Because 0.0.0.0 binds every interface inside the container, publish the debug port bound to loopback on the host so that only the host itself can reach the debugger:
docker run -p 127.0.0.1:9930:9930 ...
Publishing the port as -p 9930:9930 instead binds it on every interface of the host, which leaves the debugger reachable from anywhere that can route to the host.
When Debug Host Address is set to 0.0.0.0, the URL written to the log contains 0.0.0.0 rather than a hostname a browser can connect to:
Smile CDR JavaScript debugging enabled. Please copy-paste the following URL into a Chrome browser to continue startup: devtools://devtools/bundled/inspector.html?v8only=true&experiments=true&ws=0.0.0.0:9930/mysecretpath
Replace 0.0.0.0 with the address on which you published the port — localhost in the docker run example above — before pasting the URL into Chrome.
Troubleshooting
If the debug URL does not open a working debugger, confirm that the debug listener is actually running.
The listener answers the standard Chrome DevTools discovery endpoints, so a request to /json/list on the debug port reports the target it has registered:
curl -s http://localhost:9930/json/list
A JSON array describing a GraalVM target means the listener is running and the problem lies with the debug client.
An empty response or a refused connection means nothing is listening; check the following:
- The module creates its debug listener the first time a JavaScript callback runs, so the listener may not exist until the module has handled one request that invokes the target script.
- If the configured port is already in use, the module logs the debug URL and then reports a
BindException, and continues to run without a debugger. Search the log forBindExceptionto rule this out. Securechanges the endpoint to HTTPS, which thechrome://inspectpage cannot use. LeaveSecureset to "No" while debugging.